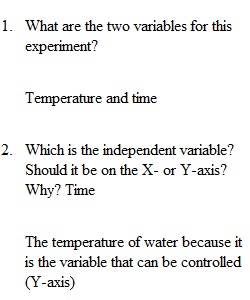


Q Data Activity 1 1. State a hypothesis for Activity 1 using an “if/then” statement. Remember to create a statement that is able to be tested empirically. If Alka-Seltzer is dropped in hot water, then it will dissolve faster than when dropped into cold water. 2. What are the two variables for this experiment? 3. Which is the independent variable? Should it be on the X- or Y-axis? Why? Time4. Which is the dependent variable? Should it be on the X- or Y-axis? Why? Temperature5. Using graphing software such as Excel®, graph the average results of Activity 1. Please see the Introduction to Graphing (lab 1) and/or the discussion board on eLearning for guidance on graph creation. Use the exponential trend line (instead of linear) to find the function that will be used to predict the times for question #8. Copy and paste the graph below. Graphs should always have an appropriate title and labeled units for the x and y axis’ (legend and equation visible if applicable). If your data doesn’t make sense, please reach out to the instructor.
View Related Questions